PsychENCODE Integrative Analysis
-
Bulk download of PsychENCODE (PEC) "Integrative Analysis" and "Derived Data Types" files: PEC Datasets tgz
-
Interactive elements: PEC Interactive Portal
-
Further details on data generation and analysis*: Integrative Flagship Paper and Supplement; Cross-Disorder Flagship Paper
-
For citation purposes: Citation of data sources
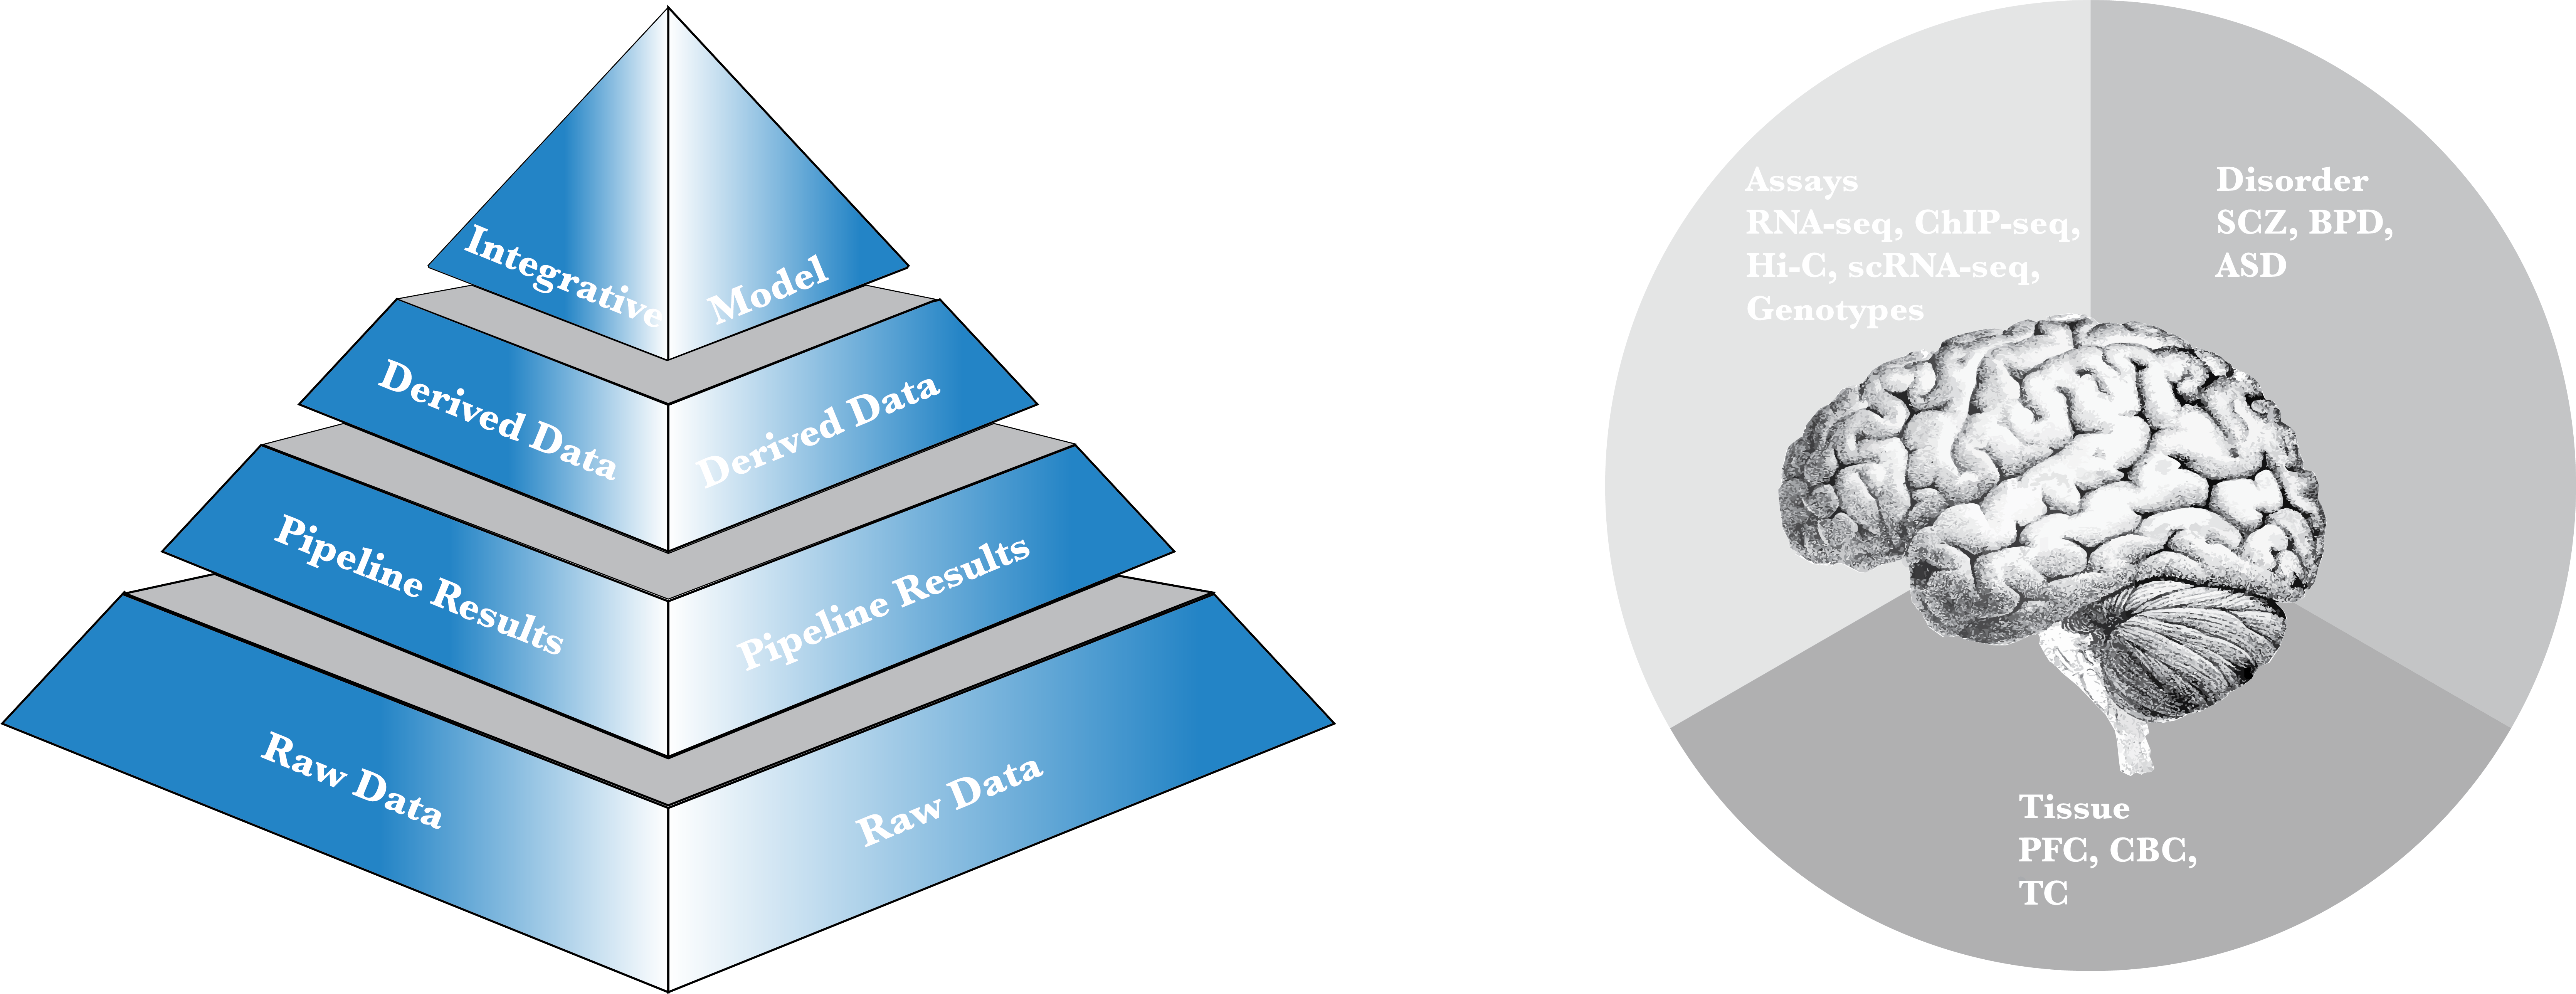
Integrative Analysis
An integration of data across the capstone projects to build a model taking QTLs as inputs and providing both phenotype predictions as well as functional modules involved.
Integrative Analysis for each brain phenotype
Integrative model parameters for all phenotypes:
Logistic Regression-Genotype:
Logistic Regression-Transcriptome:
Conditional Restricted Boltzmann Machine:
Deep Structured Phenotype Network with Imputation:
Modular Deep Structured Phenotype Network (uses WGCNA modules shared in this section):
Full Deep Structured Phenotype Network:
Multi-level functional enrichment analysis (DSPN-mod) and Weighted Gene Co-Expression Analysis (WGCNA) modules:
-
Pathway and cell-type enrichment scores: INT-07_DSPN_prioritized_module_enrichmentsxlsx120KB
-
WGCNA modules (Ensembl IDs): INT-08_WGCNA_modules_ensembl_ids xlsx17MB
-
WGCNA modules (HGNC IDs): INT-09_WGCNA_modules_hgnc_ids xlsx14MB
-
Transcription Factor - Target Gene - Enhancer linkages: The Coding Region Transcription Start Sites (TSS) were obtained from the hg19-based GENCODE v19 annotation: TSS for individual transcripts csv4MB.
Gene regulatory network 1 (GRN 1):
- Reference TF - target gene - enhancer linkages based on TF binding site analysis (before Elastic Net Regression): INT-10_Reference_Network_GRN_1 csv3GBRefSet(first 20 lines of this large file for quick reference: Header_INT-10_Reference_Network_GRN_1); version of the same file with enhancers represented by hg19 and hg38 coordinates,and PEC enhancer IDs INT-10_Reference_Network_cross_assembly_GRN_1 csv5GB
- Final TF - target gene - enhancer linkages in Gene Regulatory Network (with Elastic Net regression weight cutoff = 0.1): INT-11_ElasticNet_Filtered_Cutoff_0.1_GRN_1 csv376MB; version of the same file with enhancers represented by hg19 and hg38 coordinates,and PEC enhancer IDs INT-11_ElasticNet_Filtered_Cutoff_0.1_cross_assembly_GRN_1 csv628MB
- Mean square error for each gene from the Elastic Net Regression (only including genes with Elastic net predictions): INT-12_ElasticNet_Mean_square_error_GRN_1 csv264KB
Gene regulatory network 2 (GRN 2):
- Reference TF - target gene - enhancer linkages based on TF binding site analysis (before Elastic Net Regression): INT-13_Reference_Network_GRN_2 csv3GB (first 20 lines of this large file for quick reference: Header_INT-13_Reference_Network_GRN_2); version of the same file with enhancers represented by hg19 and hg38 coordinates,and PEC enhancer IDs INT-13_Reference_Network_cross_assembly_GRN_2 csv5GB
- Final TF - target gene - enhancer linkages in Gene Regulatory Network (with Elastic Net regression weight cutoff = 0.1): INT-14_ElasticNet_Filtered_Cutoff_0.1_GRN_2 csv211MB; version of the same file with enhancers represented by hg19 and hg38 coordinates,and PEC enhancer IDs INT-14_ElasticNet_Filtered_Cutoff_0.1_cross_assembly_GRN_2 csv353MB
- Mean square error for each gene from the Elastic Net Regression (only including genes with Elastic net predictions): INT-15_ElasticNet_Mean_square_error_GRN_2 csv264KB
HiC-derived Enhancer - Gene and Promoter linkages:
- INT-16_HiC_EP_linkages csv5MB; the version of the same file with enhancers represented by hg19 and hg38 coordinates,and PEC enhancer IDs INT-16_HiC_EP_linkages_cross_assembly csv8MB
- HiC Chromatin loops associated only with the promoter regions:
Schizophrenia-associated genes:
- SCZ High-confidence Gene List: INT-17_SCZ_High_Confidence_Gene_List csv8KB
- SCZ Risk Gene List: INT-18_SCZ_Risk_Gene_List csv24KB
- Gene regulatory network edges for SCZ High-confidence genes and associated enhancers (TF-gene and TF-enhancer lists concatenated): INT-19_GRN_SCZ_HC_genes txt772KB
Matlab code and formatted data for the DSPN:
- DSPN code for the SCZ analysis: INT-20_DSPNcode_SCZ zip1GB
- DSPN code for the BPD analysis: INT-21_DSPNcode_BPD zip2GB
- DSPN code for the ASD analysis: INT-22_DSPNcode_ASD zip3GB
- DSPN-mod code for the SCZ analysis: INT-23_DSPN-mod_code_SCZ zip1GB
- DSPN-mod code for the BPD analysis: INT-24_DSPN-mod_code_BPD zip2GB
- DSPN-mod code for the ASD analysis: INT-25_DSPN-mod_code_ASD zip3GB
- DSPN-impute code for the SCZ analysis: INT-26_DSPN-impute_code_SCZ zip1GB
- Github site (source code only): https://github.com/gersteinlab/PsychENCODE-DSPN
Figures of gene regulatory networks (GRNs) targeting cell type biomarker genes for each cell type considered:
- Excitatory Neurons: RCircos_GRN_Ex1 pdf2MB, RCircos_GRN_Ex2 pdf1MB, RCircos_GRN_Ex3e pdf7MB, RCircos_GRN_Ex4 pdf2MB, RCircos_GRN_Ex5b pdf1MB, RCircos_GRN_Ex6a pdf2MB, RCircos_GRN_Ex6b pdf1MB, RCircos_GRN_Ex8 pdf3MB, RCircos_GRN_ExS pdf5MB
- Inhibitory Neurons: RCircos_GRN_In1a pdf2MB, RCircos_GRN_In1b pdf1MB, RCircos_GRN_In1c pdf1MB, RCircos_GRN_In3 pdf2MB, RCircos_GRN_In4a pdf1MB, RCircos_GRN_In4b pdf2MB, RCircos_GRN_In6a pdf2MB, RCircos_GRN_In6b pdf2MB, RCircos_GRN_In7 pdf2MB, RCircos_GRN_In8 pdf1MB, RCircos_GRN_InS pdf6MB
- Non-neuronal cell types: RCircos_GRN_Astrocytes pdf4MB, RCircos_GRN_Endothelial pdf2MB, RCircos_GRN_Microglia pdf2MB, RCircos_GRN_Oligodendrocytes pdf5MB, RCircos_GRN_Oligodendrocyte_Progenitor_Cells_(OPCs) pdf2MB, RCircos_GRN_Pericytes pdf2MB
Derived Data Types
Gene expression matrix, enhancer lists, eQTL and cQTL maps, DEX genes, gene co-expression modules, PCA/RCA-based clustering of RNA-seq data and epigenetic data, decomposition and deconvolution of cell-type-specific RNA-seq.
Merged PsychENCODE and GTEx gene expression matrix for PFC
Gene expression matrix for the PFC (normalized from original FPKM count matrix):
- DER-01_PEC_Gene_expression_matrix_normalized txt2GB(first 20 lines of this large file for quick reference: Header_DER-01_PEC_Gene_expression_matrix_normalized)
Gene expression matrix for the PFC (in TPM):
Controls Only: Merged PsychENCODE and GTEx gene expression matrix for PFC
Gene expression matrix for 532 control samples from the PFC (normalized from original FPKM count matrix, filtered such that only genes with FPKM >= 0.1 in at least 10 samples):
PsychENCODE enhancer list and H3K27ac peaks
PsychENCODE enhancer set for the PFC:
- PEC Enhancers (hg19): DER-03a_hg19_PEC_enhancers bed3MBRefSet and DER-03b_hg19_high_confidence_PEC_enhancers bed660KB
- PEC Enhancers (hg38; converted from hg19 using USCS liftOver): DER-04a_hg38lft_PEC_enhancers bed3MB and DER-04b_hg38lft_high_confidence_PEC_enhancers bed660KB
H3K27ac peaks for the Prefrontal Cortex: DER-05_PFC_H3K27ac_peaks bed3MB
H3K27ac peaks for the Temporal Cortex: DER-06_TC_H3K27ac_peaks bed3MB
H3K27ac peaks for the Cerebellar Cortex: DER-07_CBC_H3K27ac_peaks bed2MB
QTL Maps
Expression QTLs (eQTLs), chromatin QTLs (cQTLs), isoform percentage QTLs (isoQTLs), transcript expression QTLs (tQTLs) and cell fraction QTLs (fQTLs) aligned to both hg19 and hg38 (converted from hg19 using USCS liftOver; some QTLs failed to be lifted over).
SNP information for all QTLs considered, including rsIDs (if available), location, and reference and alternate alleles: SNP Information Table with Alleles txt208MB
-
List of eQTLs:
-
Full set of cis-eQTLs with no p-value or FDR filtering: Full_hg19_cis-eQTL txt.gz3GB
-
Set with FDR<0.05 and a filter requiring genes to have an expression > 0.1 FPKM in at least 10 samples: DER-08a_hg19_eQTL.significant txt359MBRefSet and DER-08a_hg38_eQTL.significant txt359MB
Set with Bonferroni-adjusted FDR < 0.05: DER-08b_hg19_eQTL.bonferroni txt87MB and DER-08b_hg38_eQTL.bonferroni txt87MB
Set with FDR<0.05 and a filter requiring genes to have an expression > 0.1 FPKM in at least 150 samples: DER-08c_hg19_eQTL.FPKM01_min150 txt326MB and DER-08c_hg38_eQTL.FPKM01_min150 txt326MB
Set with FDR<0.05 and a filter requiring genes to have an expression > 1 FPKM in at least 20% of the samples: DER-08d_hg19_eQTL.FPKM1_20per txt255MB and DER-08d_hg38_eQTL.FPKM1_20per txt255MB
Cross-Disorder Analysis Set used for summary-data mendelian randomization (SMR) including 100 hidden covariate (HCP) factors: DER-08e_hg19_eQTL_HCP100_forSMR txt520MB and in binary format (.besd, .epi, .esi files zipped together) DER-08e_hg19_eQTL_HCP100_forSMR_binary_format zip76MB
-
-
List of cQTLs: DER-09_hg19_cQTL.significant txt328KBRefSet and DER-09_hg38_cQTL.significant txt328KB
-
List of isoQTLs:
Core isoQTL set with FDR<0.001: DER-10a_hg19_isoQTL.significant txt373MBRefSet and DER-10a_hg38_isoQTL.significant txt373MB
Filtered isoQTL set with FDR<0.001 and a filter requiring genes to have an expression > 5 FPKM in all samples: DER-10b_hg19_isoQTL.FPKM5.all txt76MB and DER-10b_hg38_isoQTL.FPKM5.all txt76MB
- Core tQTL set with FDR<0.001: DER-10c_hg19_tQTL.all txt327MB and DER-10c_hg38_tQTL.all txt327MB
- Filtered tQTL set with FDR<0.001 and a filter requiring genes to have an expression > 5 FPKM in all samples: DER-10d_hg19_tQTL.FPKM5.all txt94MB and DER-10d_hg38_tQTL.FPKM5.all txt94MB
-
List of fQTLs: DER-11_hg19_fQTL.significant txt244KBRefSet and DER-11_hg38_fQTL.significant txt244KB
-
List of multiQTLs (QTLs overlapping between two of the categories out of eQTLS, cQTLs and fQTLs): DER-12_hg19_multiQTL.list txt4KB
Differentially Expressed (DEX) and Spliced Genes/Transcripts and Gene/Isoform Co-expression modules
This resource provides sets of genes that exhibit significantly different expression levels between different groups of samples.
-
Cross-Disorder DEX Genes and Transcripts, and Differentially Spliced Genes of PsychENCODE samples (from Cross-Disorder Analysis Paper):
- Cross-Disorder DEX Genes: DER-13_Disorder_DEX_Genes csv296KB
- Cross-Disorder DEX Transcripts: DER-14_Disorder_DEX_Transcripts csv288KB
- Differentially Spliced Genes: DER-15_Disorder_DifferentialSplicing csv104KB
-
Gene and Isoform Co-Expression Modules calculated using Weighted Gene Co-Expression Analysis (WGCNA) on the PEC RNA-seq samples (from the Cross-Disorder Analysis; included as supplementary table S5 in Gandal et al 2018; see Cross-disorder_README for details on annotations):
- Gene Co-expression Modules: DER-16_Disorder_Gene_Modules csv452KB
- Isoform Co-expression Modules: DER-17_Disorder_Isoform_Modules csv1016KB
TAD regions from adult DLPFC
Cross-Disorder Analysis TWAS weights
This resource provides the weights associated with the Transcriptome-wide Association Study (TWAS) conducted as part of the Cross-Disorder Analysis: PEC_TWAS_weights txt.tar.gz896MB
TAD regions from adult DLPFC
Bulk RNA-seq Decomposition and Deconvolution with Single-cell Data
-
Brain Cell-type Marker Genes and Single-cell Expression Data (in units of TPM), from PEC (Developmental), Darmanis et al. 2015 and Lake et al. 2016
-
Marker genes merged from Darmanis 2015 and Lake 2016 sources: DER-19_Single_cell_markergenes_TPM xlsx44KB
-
Processed single-cell expression data merged from all three sources: DER-20_Single_cell_expression_processed_TPM tsv275MB
-
-
Brain Cell-type Marker Genes and Single-cell Expression Data (in units of UMI), from PEC (Adult) and Lake et al. 2018
-
Marker genes merged from both sources: DER-21_Single_cell_markergenes_UMI xlsx112KB
-
Raw single-cell expression data merged from both sources: DER-22_Single_cell_expression_raw_UMI tsv899MB
-
-
Cell Fractions Derived from Deconvolution:
-
Raw Fractions: DER-23_Cell_fractions_Raw xlsx388KB
-
Normalized Fractions: DER-24_Cell_fractions_Normalized xlsx388KB
-
-
Decomposition through Non-negative Matrix Factorization (NMF):
-
NMF Components: DER-25_NMF_comp xlsx716KB
-
NMF Fractions/Coefficients: DER-26_NMF_coef xlsx216KB
-
External references: Darmanis et al. 2015, Proc. Nat. Acad. Sci. U.S.A. 112(23), Pgs. 7285-90; Lake et al. 2016, Science 352(6293), Pgs. 1586-90; Lake et al. 2018, Nat. Biotechnol. 36(1), Pgs. 70-80
Pipeline-Processing Results
RNA-seq quantifications, ChIP-seq signals and peaks, Brain Transcriptionally Active Regions (TARs), Imputed Genotypes (secured),and Phenotypes.
Access to all files tagged as "controlled" is login-secured. The raw data used in these publications are available to the research community as described under Access Instructions.RNA-seq signals and peaks
Signal tracks (.bigwig) and peak (.bedgraph) files calculated using PsychENCODE pipeline, available on Synapse:
ChIP-seq signals and peaks
Signal tracks (.bigwig) and peak (.bed, .narrowPeak, .gappedPeak, and .broadPeak) files calculated using PsychENCODE pipeline, available on Synapse:
Hi-C matrices
-
Hi-C matrix for DLPFC at 10kb resolution: PIP-01_DLPFC.10kb txt.tar.gz6GB
-
Hi-C matrix for DLPFC at 40kb resolution: PIP-02_DLPFC.40kb txt.tar.gz6GB
Cortex Transcriptionally Active Regions (TARs)
- Genome-wide TARs within each sample:
- Genome-wide TARs that are found within at least 70% of the individuals:
Raw Data
Alignment files for the various experiments, chip arrays for the SNP genotyping assays and phenotype metadata for the different studies under the consortium; external links are provided for the data sources on Synapse, and the GTEx consortium and Roadmap Epigenomics Consortium web portals.
Access to all files tagged as "controlled" is login-secured. The raw data used in these publications are available to the research community as described under Access Instructions.List of all datasets used in the integrative analysis
List of datasets including ssource study, disease status of samples, source tissue(s), downstream analyses conducted using the data and the number of datasets: RAW-01_PEC_Table_of_Datasets xlsx28KB
Assay Cross-Reference
Master table that includes mappings between matched RNA-seq, ChIP-seq and Genotype files (link to Synapse): RAW-02_Assay_Cross_Reference and Links from Individuals to Studies
Bulk and Single-cell RNA-seq alignment files
-
PsychENCODE Bulk RNA-seq alignment (.bam) files (link to Synapse):
-
GTEx Bulk RNA-seq alignment (.bam) files (link to GTEX consortium web portal):
-
PsychENCODE Single-cell RNA-seq (.fastq) files (link to Synapse):
Bulk ChIP-seq alignment files
-
PsychENCODE Bulk ChIP-seq alignment (.bam) files (link to Synapse):
-
Roadmap Epigenomics Consortium (REMC) Bulk ChIP-seq alignment (.tagAlign) files (link to the REMC web portal):
Genotypes
The integrative analyses, such as the QTL calculations, included samples external to the PsychENCODE consortium and it is therefore not appropriate to include the full genotype set on Synapse under the PsychENCODE project. We avoid creating a merged genotype file of the remaining samples to avoid any confusion, as the results of this partial file would not be the same as the full sets of results herein. Instead, please see Genotype Sample ID map for a list of genotyping sample IDs for all individuals used in this analysis.
-
Integrative Analysis and Cross-Disorder Analysis Genotype vcf files (link to Synapse):
-
Metadata for imputed genotypes (link to Synapse):
Phenotypes
In the following we provide two links: one is for the full set of clinical metadata, available to those with full access permissions granted by Synapse; the other is a publicly accessible, limited set of clinical metadata.
Full demographic and clinical information on individuals included in this analysis (link to Synapse):
Publicly accessible, limited demographic and clinical information on individuals included in this analysis (link to Synapse):
Cross-Disorder Analysis Data
RNA-seq and SNP array files used in the Cross-Disorder Analysis (link to Synapse):
Developmental Analysis Data
FASTA file for RNA-seq spike-in sequences: